
New Study Shows Maryland Schools Have $2.9 Billion in Unmet Needs
More than four years ago
Breaking down the Kirwan Commission Adequacy Study.
Money matters in education. Earlier this year, researchers with the National Bureau of Economic Research demonstrated substantial improvements in student achievement — especially for low-income students — following increases in public education funding. The authors didn’t mince words, writing, “Our results thus show that money can and does matter in education.”
This finding is supported just by looking at how much states spend per pupil and where they place in national education rankings.
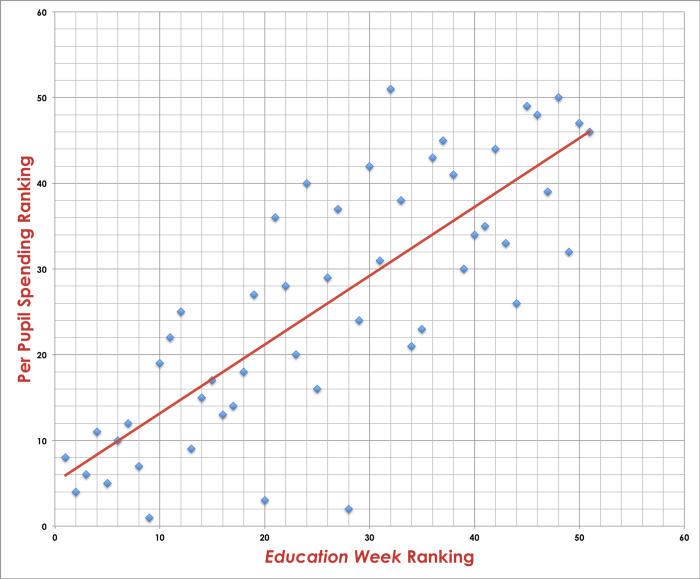
Maryland actually punches above its weight in this analysis, ranking fourth nationally in Education Week’s rankings but ranking 11th in per pupil spending. In fact, all three of the states ranking better than Maryland — Massachusetts, New Jersey, and Vermont — spend more per pupil. But you can see how at every ranking level of per pupil spending, there’s a strong relationship with school effectiveness. It’s a good rule of thumb in the United States that if your state spends more on education, it likely gets better student outcomes.
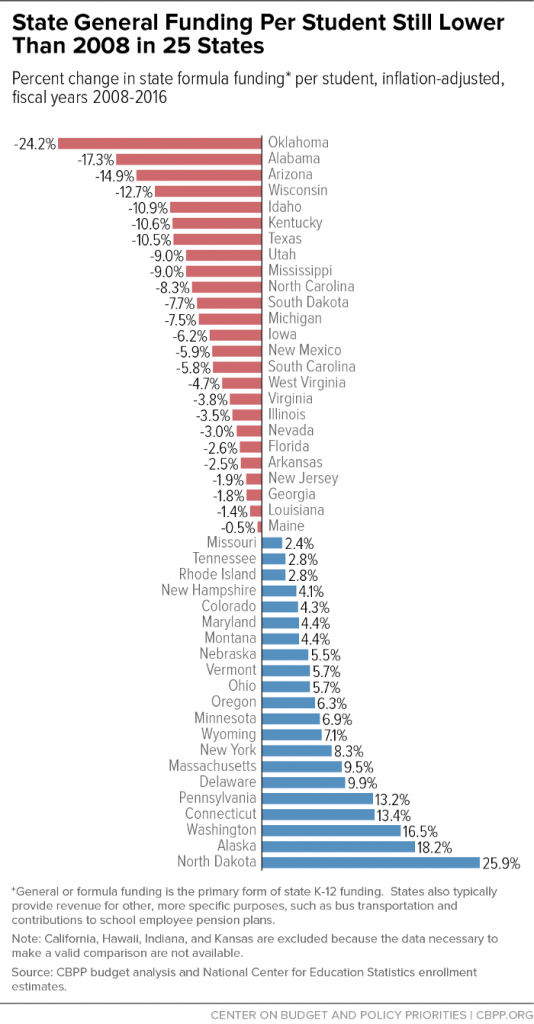
But what gets lost in state-to-state comparisons is the fact that every state is now trying to meet higher academic standards without proportionally higher funding for schools. The combination of decreases in education spending after the Great Recession (both overall and in respect to growing enrollment and inflation) and the widespread adoption of the Common Core State Standards has left dramatic unmet needs in America’s public schools.
Both the implementation of Common Core and the continued use its higher standards bring additional costs to schools. Districts had to purchase new Common Core-aligned curricula, learning materials, and assessments. Educators needed professional development and training to learn the new standards. Schools had to spend hundreds of millions of dollars on new technology to administer the tests. Now that all this is implemented, schools still need more staff and better training to give the individualized instruction necessary to boost student skills to new heights.
This week, we got an answer for exactly how big that gap is in Maryland: $2.9 billion. That’s the conclusion of a two-year study conducted by Maryland State Department of Education consultants — the very same national experts on school finance who developed Maryland’s current “Thornton” school funding formula, which has served as a national model for its pioneering focus on equity.
“This independent, fact-based analysis of Maryland public school funding lays out exactly the kind of bold, comprehensive investment our state needs to give every child an opportunity at future success. If our schools have $2.9 billion of unmet needs — as these researchers have demonstrated — then we owe it to our kids to overcome political fears and find a way to better invest in their education.”
— MSEA legislative director Sean Johnson
Their methodology was simple yet powerful: ask educators in Maryland schools what they would need to help students meet higher standards, and then consult the best education research available to verify those judgments and determine how much the suggested strategies would cost.
The recommendations were presented to the Kirwan Commission — the new state commission proposing changes to the public school funding formula — during their third meeting.
The Proposed Kirwan Commission Funding System
To close that $2.9 billion funding gap, the experts recommended a new state school funding formula that helps provide educators the resources they need to help all students reach better achievement levels. Here’s how it would work:
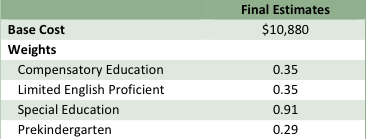
Increase the base per pupil amount that school systems receive to educate every child from $6,860 to $10,880.
This change is the main driver of the increase in public school spending recommended by the experts. It’s a 58% increase aimed at putting a greater emphasis on providing resources to all students, instead of differentiating more on particular student populations. Based on conversations with educators, they argue that all students face higher demands now with new standards and the majority of students come to school with significant needs — whether based on academics, behavioral issues, family situations, difficulties with language, or other common obstacles faced by students.
School systems also stress that there are many mandates from the state designed to improve school climate and academic success, but often times they come with no additional funding to help make them happen. For example, mandates on standardized testing and student behavior have been major drivers of increased cost, crowding out funding for instruction.
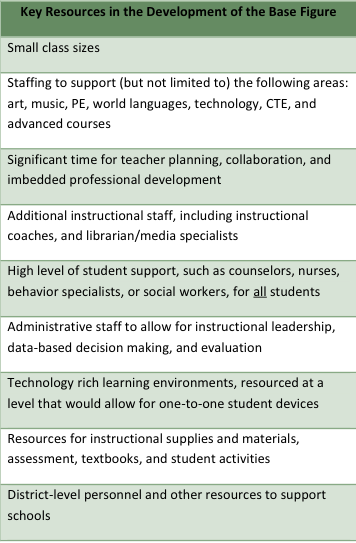
To justify the large increase in funding, the experts list out nine key strategies that will now be possible with increased spending.
Significantly increase the weighting for special education students, while still providing increases for low-income students and English language learners.
One of the biggest changes in this proposal and the old Thornton model is adjusting the amount of extra funding districts receive to meet the higher demands of students with special education needs. Under Thornton, each special education received the base amount plus 74% of the base amount. Under this plan, special education students would draw in the base amount plus 91% of the base amount. This addresses the finding that special education services have been extremely underfunded — especially when it comes to staffing — based on what students really need to achieve similarly to their peers.
However, the weighting for low-income students and English language learners does drop significantly from .97 and .99 respectively to .35. The experts argue that this model still provides increases in funding for those students because the base amount is so much higher and now counties would be required to fund their share of those dollars, whereas currently it isn’t mandated and often goes unfunded in some districts.
Under the Thornton model, for every low-income student, districts would receive $6,860 + (.97 x $6,860) = $13,514 on average.
Under the proposed model, for every low-income student, districts would receive $10,880 + (.35 x $10,880)= $14,688 on average.
Add an early childhood education factor to fund universal public pre-K for all four-year-olds.
Based on a thorough literature review, the experts determined that making public pre-K available to all four-year-olds would significantly boost student performance, yielding a return on investment of $5.54 for every dollar spent. To help districts fund the increase in slots available, they recommend that an additional .29 weighting be added for pre-K.
Increase equity between wealthy districts and poor districts by placing a greater emphasis on income.
Under the Thornton model, local wealth was determined by adding property values to taxable income, with the idea being that property taxes and income taxes are how counties pay for education. Counties with less ability to raise revenue for education get more help from the state, and those with more ability get less help. Assuming counties are funding their districts based on their ability to do so, the differentiated state aid makes the funding for all schools equitable.
Unfortunately, that hasn’t exactly played out in reality. The report notes that students in wealthier districts still get more local and state funding than their less wealthy counterparts, which has been backed up by analysis by The Washington Post and the Education Trust.
To help correct this, the experts suggest the state determine local wealth by multiplying property values by the ratio of a county’s net taxable income divided by the state average net taxable income. This makes income much more influential in the wealth determination than property values, which is important because property does not reflect true wealth as accurately as income.
There are other details in the report that make relatively smaller adjustments to the formula — like changes to how districts receive more funding for being in an area with a higher cost of living — that we will explain in greater detail as they come up for discussion in the Kirwan Commission. Members of the Commission will now be tasked with taking these recommendations and determining how they need to be adjusted to build the political will to close the $2.9 billion funding gap our schools face.